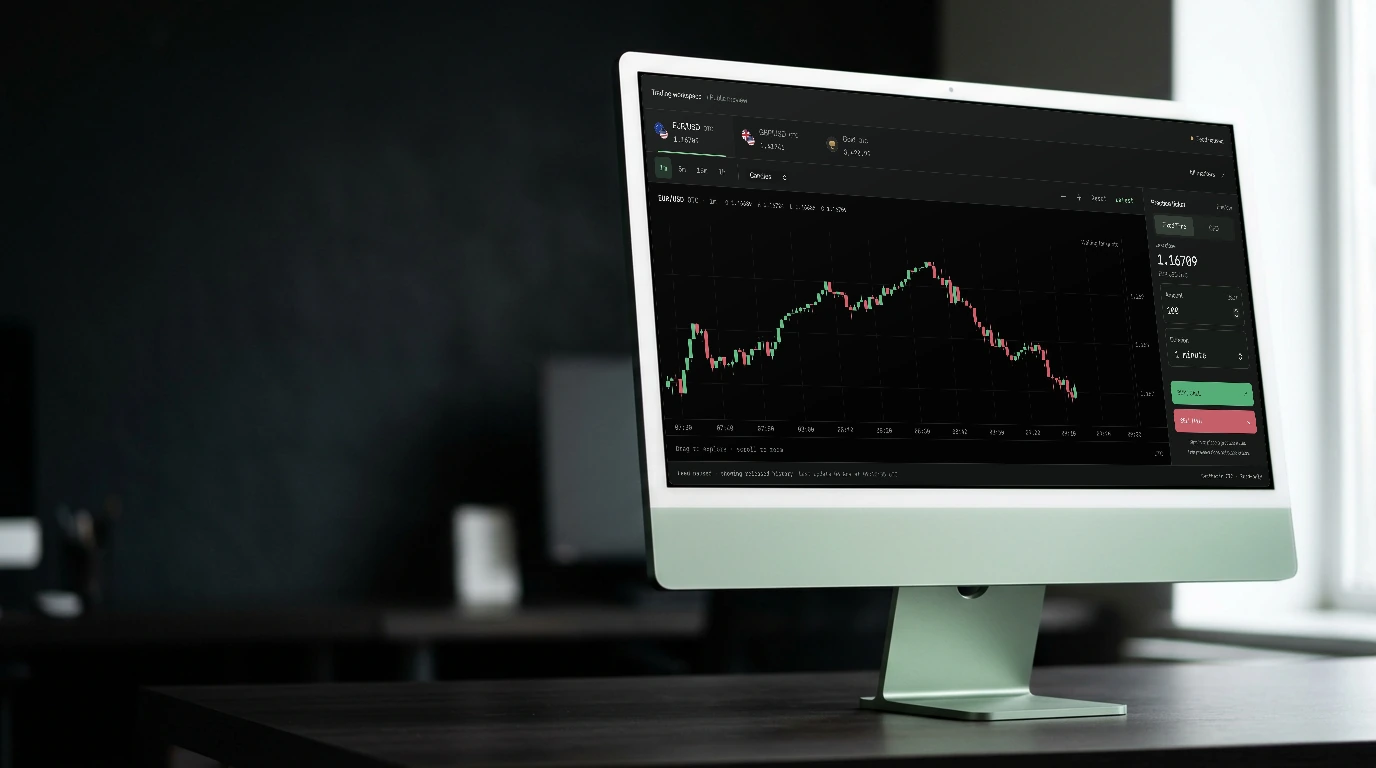
Practice accountGet familiar with the controls.
Learn more
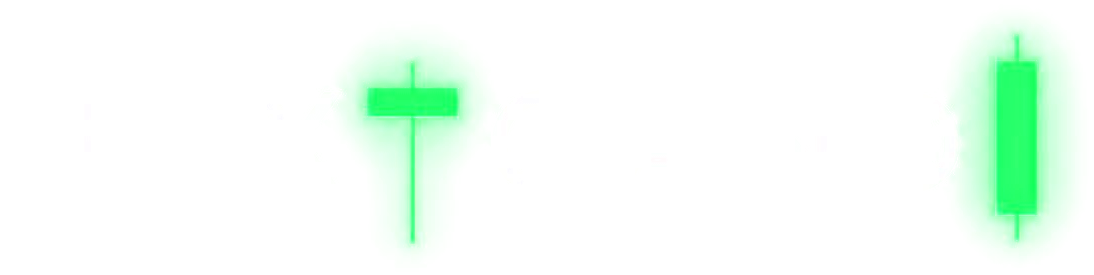
6 chart styles
Candles, bars, line, area, baseline and Heikin Ashi — with four price scales.
“Same price. Different truth.”
A WINDOW INTO YOUR TERMINAL
Connecting to marketsLoading current prices and candle history.
Six chart styles and four price scales for different ways of reading price.
KEEP EXPLORING

Analysis
One, two or four charts. Different timeframes. One focused workspace.
Explore feature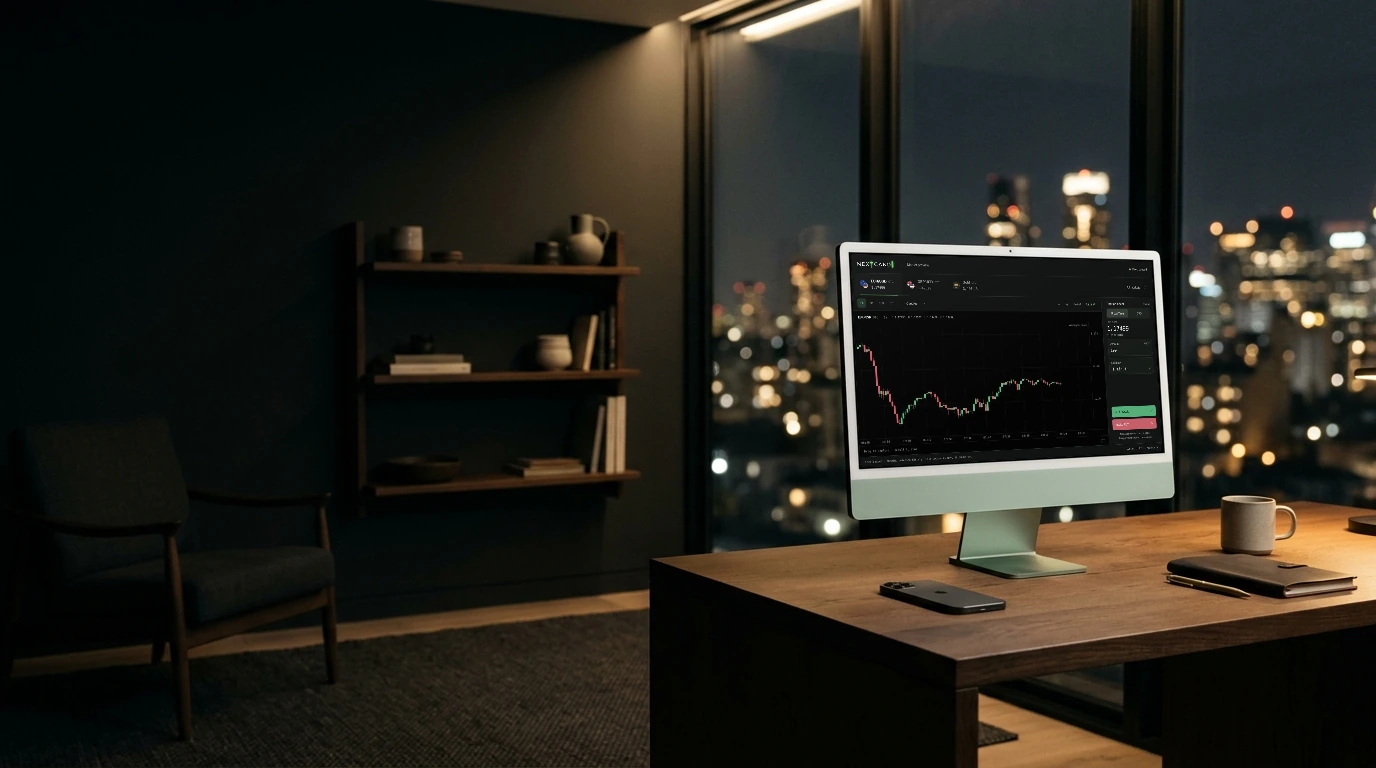
Analysis
84 studies, from familiar trend overlays to momentum and volatility tools.
Explore feature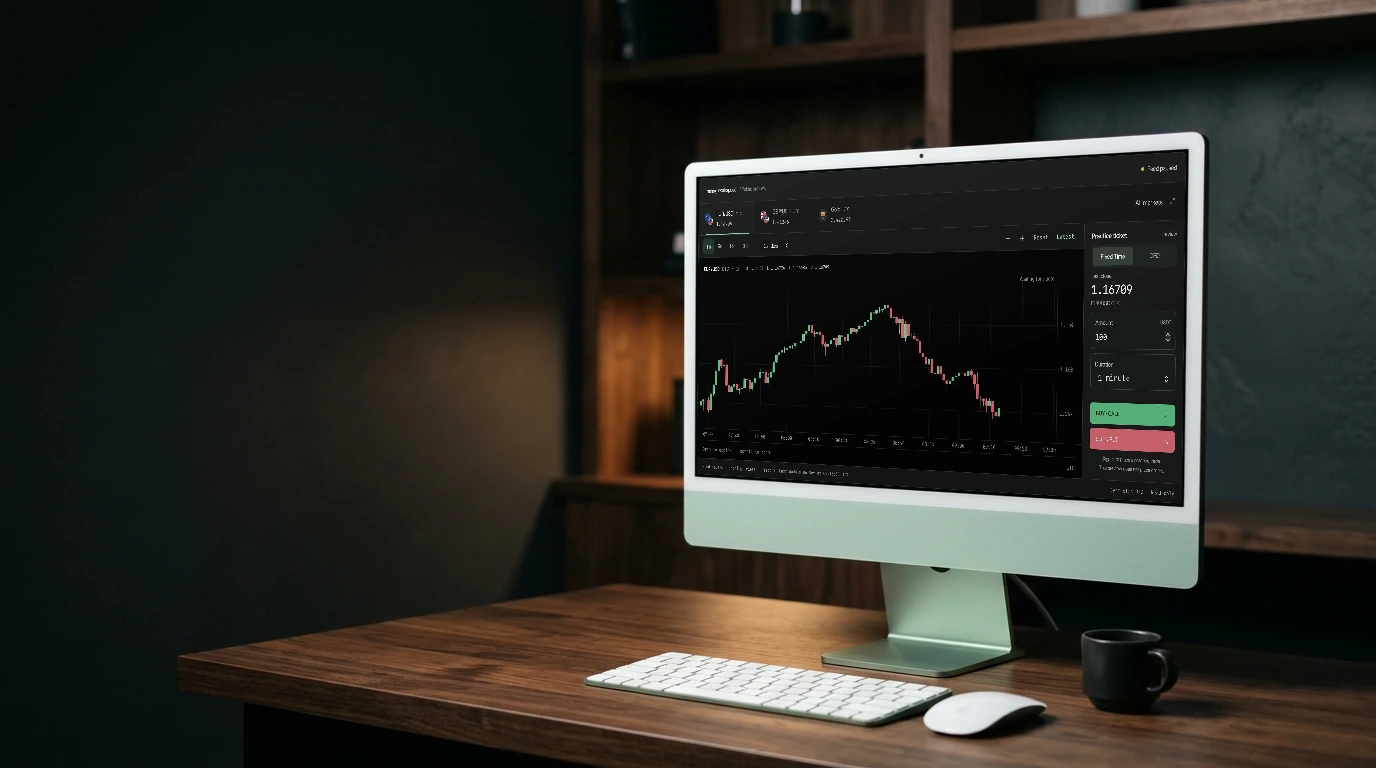
Plan the trade. Trade the plan.
NEXT CANDL

6 chart styles
Six chart styles and four price scales for different ways of reading price.
Open the workspaceChoose candles, OHLC bars, line, area, baseline or Heikin Ashi. Heikin Ashi is a derived view of the source candles.
Switch among regular, logarithmic, percentage and indexed scales. Choose the scale that makes the comparison you want easier to read.
Drag to move through visible history, zoom into a period, or fit the chart again. Your chosen view stays inside the same workspace.