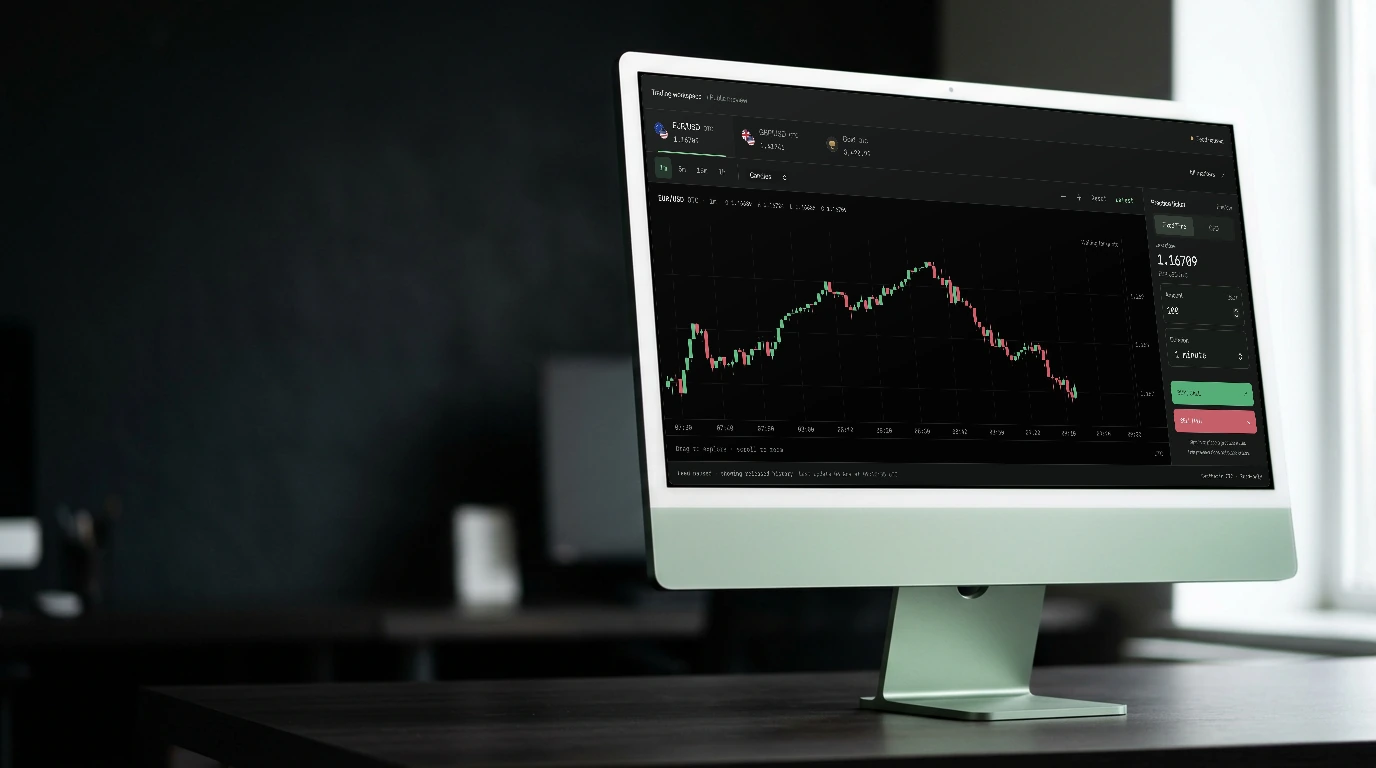
Practice accountGet familiar with the controls.
Learn more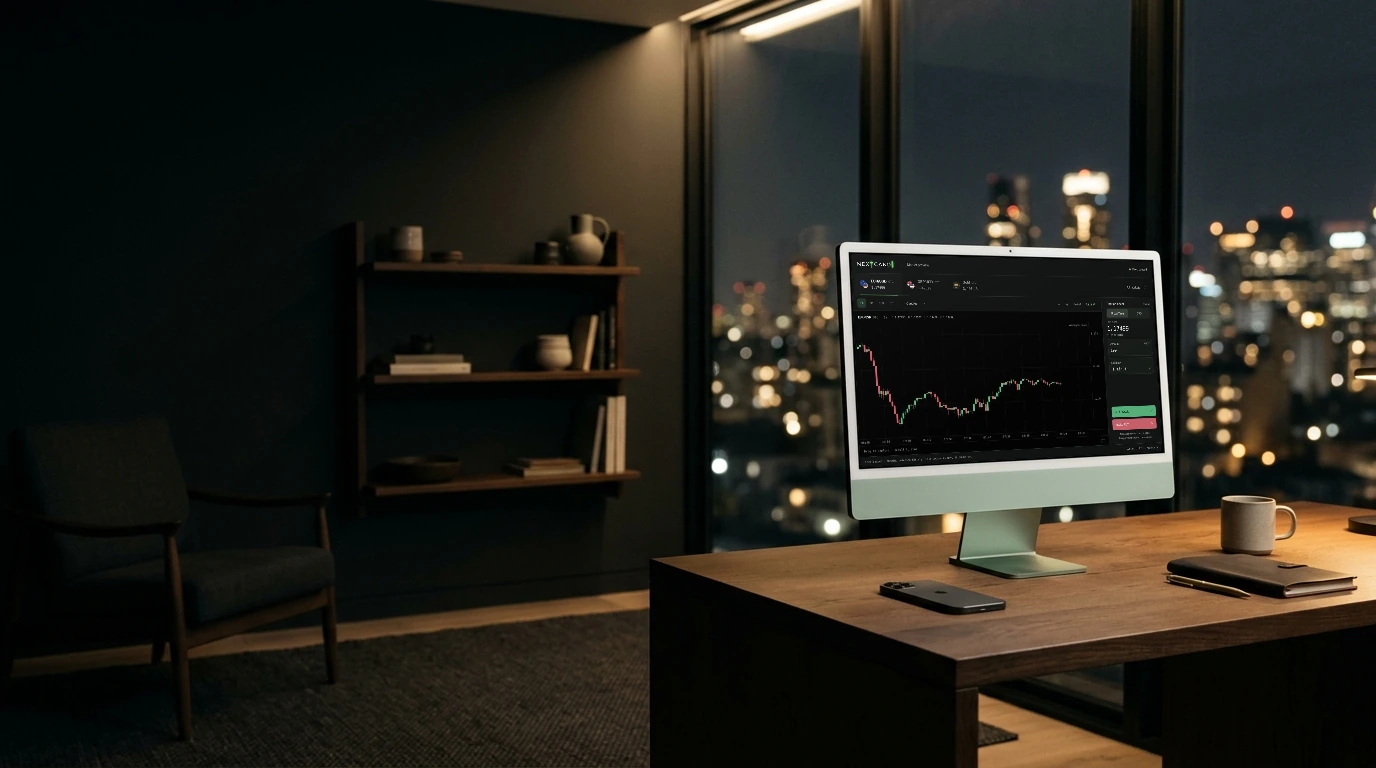

Multiple charts
One, two or four charts of the selected instrument, each on its own timeframe, with linked crosshairs.
“A single timeframe is a single opinion.”
A WINDOW INTO YOUR TERMINAL
Connecting to marketsLoading current prices and candle history.
One, two or four charts. Different timeframes. One focused workspace.
KEEP EXPLORING

Analysis
84 studies, from familiar trend overlays to momentum and volatility tools.
Explore feature
Analysis
Mark the levels, patterns and areas you want to follow.
Explore feature
Everyone has a strategy until the candle closes.
NEXT CANDL
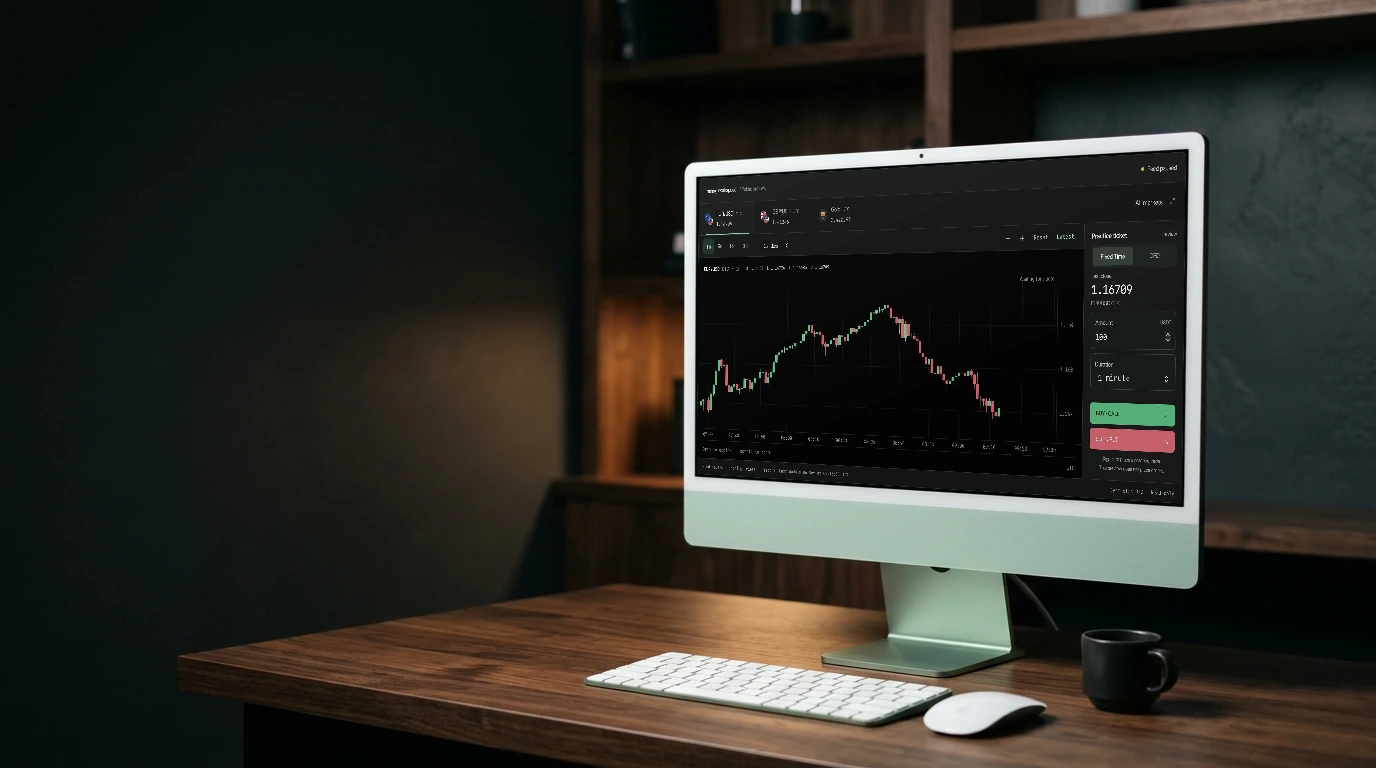
1 / 2 / 4 charts
One, two or four charts. Different timeframes. One focused workspace.
Open the workspaceChoose a single focused chart, a two-chart comparison, or a four-chart layout in Analysis Studio.
Each companion view can show another timeframe for the selected market. Compare shorter and longer periods without repeatedly switching the main chart.
Linked crosshairs help align the point you are examining across the visible charts. The main chart carries the complete study and drawing toolset.