
Practice accountGet familiar with the controls.
Learn more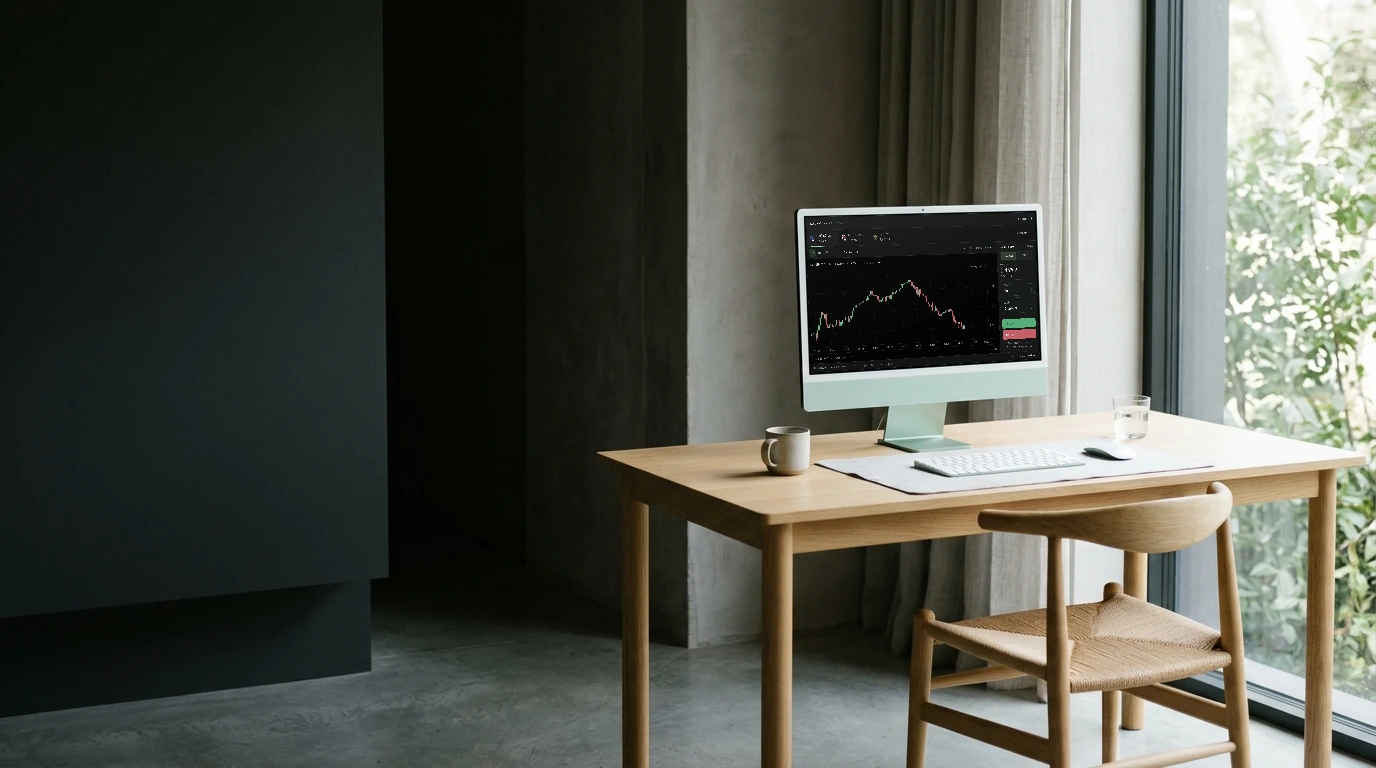

12 timeframes
Twelve intervals for reading the same market at the scale that matters to you.
“Zoom out before you freak out.”
A WINDOW INTO YOUR TERMINAL
Connecting to marketsLoading current prices and candle history.
12 timeframes, from five seconds to one month.
KEEP EXPLORING

Analysis
One, two or four charts. Different timeframes. One focused workspace.
Explore feature
Analysis
84 studies, from familiar trend overlays to momentum and volatility tools.
Explore feature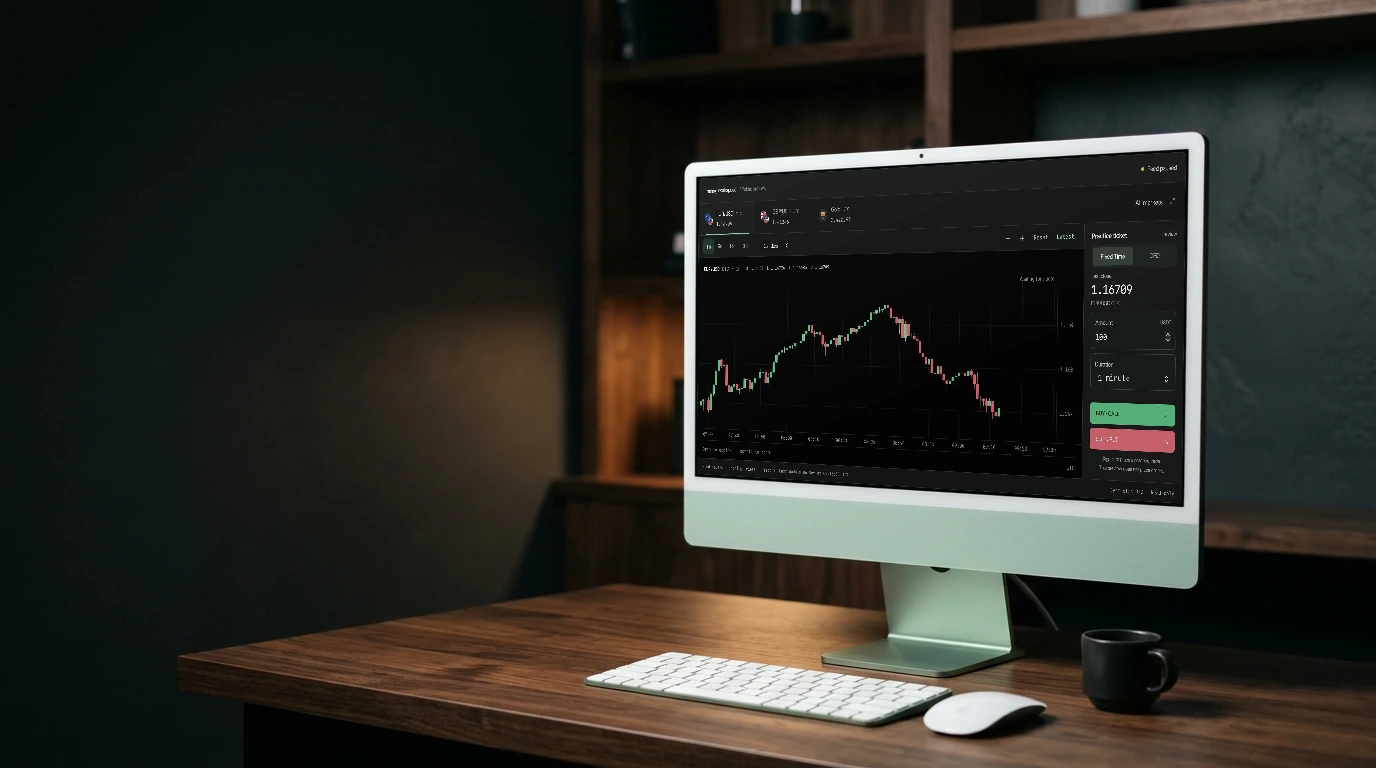
Amateurs predict. Professionals prepare.
NEXT CANDL

Use the shorter intervals to examine individual periods in detail: five, fifteen or thirty seconds, or one, five and fifteen minutes.
Switch to thirty minutes, one hour, four hours, one day, one week or one month when you want a broader view of the same market.
Choose UTC or IST for the chart’s time labels. Changing the displayed timezone does not change the underlying market timestamps.